Lots of hot air

UKworkshop.co.uk

Help Support UKworkshop.co.uk:

This site may earn a commission from merchant affiliate links, including eBay, Amazon, and others.
Maintaining the proportion of younger people in a society to provide the energy to deliver that which the retired and elderly require is completely unsustainable without population growth.

The reason - increasing number of elderly people arising from improvements in life expectancy due to healthcare, diet, etc. To some extent the additional demands have been offset by increasing the retirement age - but by no means sufficiently.

The modern UK state pension was started by the Old-Age Pensions Act 1908, which provided 5 shillings (£0.25) a week for those over 70.

In 1908, if you reached 65 (most didn't) after 50 years of work you may expect to live another 12 years. Life expectancy (average) was ~50 due to child mortality and other incurable illnesses.

In 2020 you can expect to live ~20 years at 65, average life expectancy at birth is ~80 years.

If overpopulation is seen as a problem (I think it is) - both environmentally and socially - there are only a few options:
  • make people work longer whilst remaining in adequate health
  • reduce care for the elderly
  • reduce pensions for the retired
  • reduce living standards for the young, apply resources to economically inactive elderly
  • services increasingly provided by automation and robots (??)
As explicit policies many/all seem fairly unattractive - for some morally repugnant.

This may be why governments worldwide are reluctant to implement birth control policies as they will be aware that it would accelerate the need to make these difficult choices.

But the reality is that even without explicit policies this is what is actually happening!
You've missed out the big obvious option which is well known and well documented, which is to share out the wealth of the world a bit more equally. World’s billionaires have more wealth than 4.6 billion people | Oxfam International
In other words there could be no population problem if we resolved the wealth distribution problem.
In principle this could lead to reducing populations as people would have more control over their lives, particularly if women were more liberated.
It won't happen of course - the world is quietly resigning itself to let nature take its course and bump a lot of us off randomly. Likely to be the poorest first, who also happen to have the lowest carbon footprint, so it won't be very fair!
 
Last edited:
Little did I think when joining this forum recently for wood lathe reasons that I would be drawn into a discussion on population control & climate change. Funny old world innit...... tho unfortunately probably not that much longer as far as humans are concerned.
 
Little did I think when joining this forum recently for wood lathe reasons that I would be drawn into a discussion on population control & climate change. Funny old world innit...... tho unfortunately probably not that much longer as far as humans are concerned.

Not another doom monger :rolleyes:
 
I've been horribly busy, so unable to keep up with this fabulously enthusiastic, edifying thread. Apologies for that.

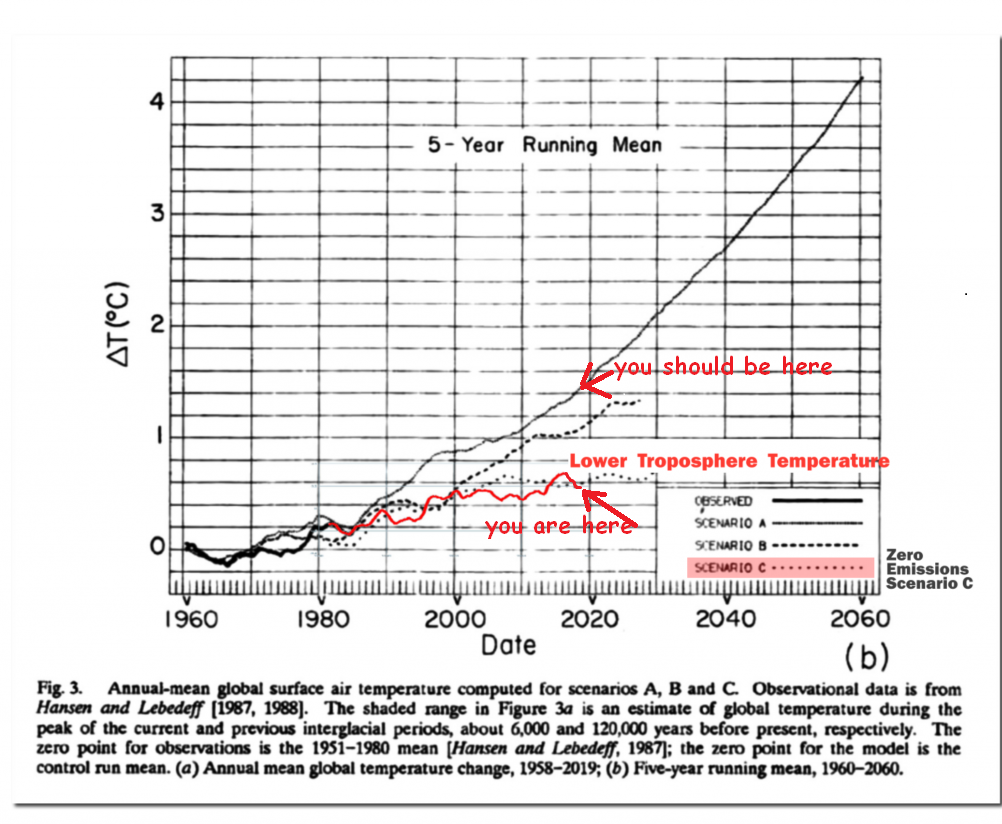
christy-dec8.jpg


Another similar one here:

predictions.png


See if you can spot anything in your life in the following list:
https://listverse.com/2019/09/26/climate-change-religion/
 
Little did I think when joining this forum recently for wood lathe reasons that I would be drawn into a discussion on population control & climate change. Funny old world innit...... tho unfortunately probably not that much longer as far as humans are concerned.
Ah well if you get rattled by any one or topic you can take a piece of wood and a hammer and chisle and knock 7 bells of dung out of it now thats woodworking at its best ( although with the price of wood lately might be a dear form of stress relief ) lol
 
Ah well if you get rattled by any one or topic you can take a piece of wood and a hammer and chisle and knock 7 bells of dung out of it now thats woodworking at its best ( although with the price of wood lately might be a dear form of stress relief ) lol
I've resorted to bashing a gold bar ingot, far cheaper at the moment...?..
 
Ah well if you get rattled by any one or topic you can take a piece of wood and a hammer and chisle and knock 7 bells of dung out of it now thats woodworking at its best ( although with the price of wood lately might be a dear form of stress relief ) lol
Thank you for the advice Thingybob....have been trying that for many years & it works...& even got paid for it. You are right about the wood prices ..... luckily have some in stack that will last a few years or until I drop off the perch.......& fastenings...but that is covered in another thread.
 
Just to upset all you youngsters out there this is a price list from early 80s and i never bought there as they were too dear mostly DIY ers used them
20210905_221618.jpg
Eh them wert days ps thats price per foot
 
Thank you for the advice Thingybob....have been trying that for many years & it works...& even got paid for it. You are right about the wood prices ..... luckily have some in stack that will last a few years or until I drop off the perch.......& fastenings...but that is covered in another thread.
Is that a pun (another thread) Whitworth or Metric
 
I guess it has been a very long time since you went to school, oh well.
:rolleyes:
Why would you say that?
It's true, of course, but I have used elementary arithmetic since I left school.
All I'm saying is that the one graph shows an increase of 100%, the other shows an increase of 77%. The y axes have been chosen to make the trend look identical.
This is simple stuff.
Kindly refrain from rolling eyes and ageist insults.

The graph on the left doesn't show a 100% increase, you are looking at one years data, as you can see it goes up and down, so the trend line is lower. The graphic also doesn't say they are equal, it say that they are almost the same, the population is ageing considerably so the effect is going to be greater. The point of the graphic is to show that looking at graph 1 does not give you the whole picture and you need to dig a little deeper. I thought you might have been able to understand that. I have deleted the school comment, it was unfair, I apologise, but the point still stands, you are seeing what you want to see, not the whole picture hence the rolling eyes.
 
Back
Top